Many projects are structured in a way that a company delivers a certain output over weeks and months (such as software development), but is only paid at the end of the project. This poses an accounting challenge as the costs for developers are incurred monthly. Simplified, the company may incur losses for several months with the project and then make a significant profit in the last month. This trajectory is particularly problematic if the project extends beyond the fiscal year boundary.
Modern accounting has a solution for this, called "capitalization of work in progress." Here, the amount of work done in a project is considered on a monthly basis and calculated as revenue if the client were to pay for this work monthly. The basis is the entire contract value distributed over the planned (or reported) work per month of the project. On the other hand, the actual costs of the team can be determined based on time tracking. This reveals how much money was earned per month on the project, even if the actual payment (cash flow) comes at the end of the project.
Can Do has developed a dedicated app for this analysis for a project. This app considers the payment milestones, planned, and reported work hours.
The app consists of three parts. The first part displays the values in a graph. In the example, you can see that there was likely a partial payment in November (red line) while the light blue line represents the monthly capitalization.
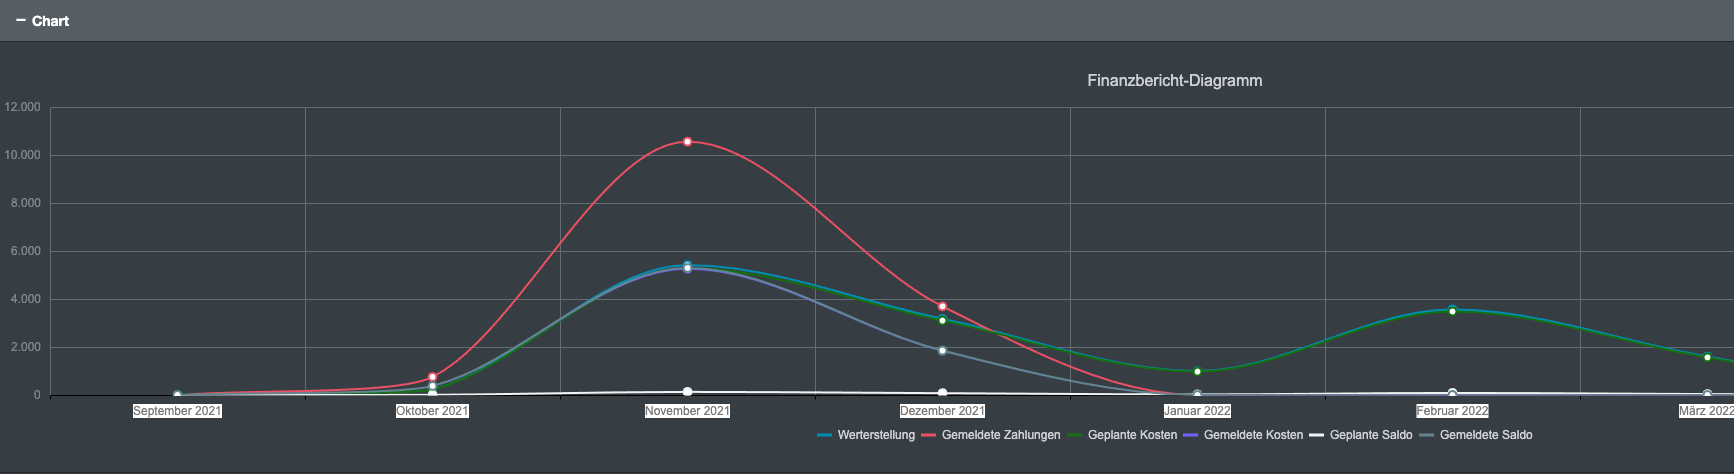
This can be better observed in the table in the second part. Here, the planning (planned work) is taken into account:

In the "Balance" row, you can see the accounting profit. This project is just breaking even.
In the third part, the actually reported work is used.

The app is aimed at all users who need to report monthly revenue values from ongoing projects to the controlling or accounting department. The app can also be used across multiple projects or entire portfolios.


 Thomas Schlereth
 Ariane Becker : 26.02.2026
